
 Educational Value Added in Poland
Educational Value Added in Poland
The Polish Educational System
In Poland, standardized compulsory national exams were introduced in 2002. First exams were launched at the end of primary (ISCED1) and lower secondary education (ISCED2), and as of 2005 a standardized Matura exam at the end of upper secondary schools (ISCED3) was also introduced. In lower secondary schools students graduate regardless of the score, and at the upper secondary level a cut-off score is introduced at 30 per cent of the total score. The scores obtained by students in the upper secondary level exams serve as a basis for the recruitment process at subsequent levels of education. On all levels of education school mean scores were the main, and in fact the only existing information about school performance and effectiveness. This approach was criticized and it was decided to use also the examination results in an extended way by looking at EVA measures.
Educational Value Added models
In recent years, the so-called value-added scores have often been considered as much better indicators of school effectiveness for policy purposes (OECD, 2008). In national assessments, a school’s mean score is rarely taken as a measure of the school’s efforts because it largely depends on the socio-economic characteristics of students and only partly on how well the teachers work. Thus, value-added scores, which take into account prior student scores or look at growth trajectories and the impact schools or teachers have on them, are more often preferred when assessing schools and teachers. While these methods are still being developed, there is no doubt that they provide more useful policy indicators than average scores collected at a single moment in time.
Educational Value Added in the Polish educational system
In 2005 a group of experts started developing a methodological and statistical background for the Polish version of EVA models designed for school evaluation. Until 2012 three models were developed: two models for lower secondary schools and one model for higher secondary schools.
The first model in the lower secondary school is based on a fixed effect regression methodology and is designed for within-school evaluation. A special computer program for within-school evaluation was developed and is downloadable free of charge from the EVA Website. In Figure 1. an example window from this program is presented. Each school can download this program, import its own data, and perform its own in-depth analysis.
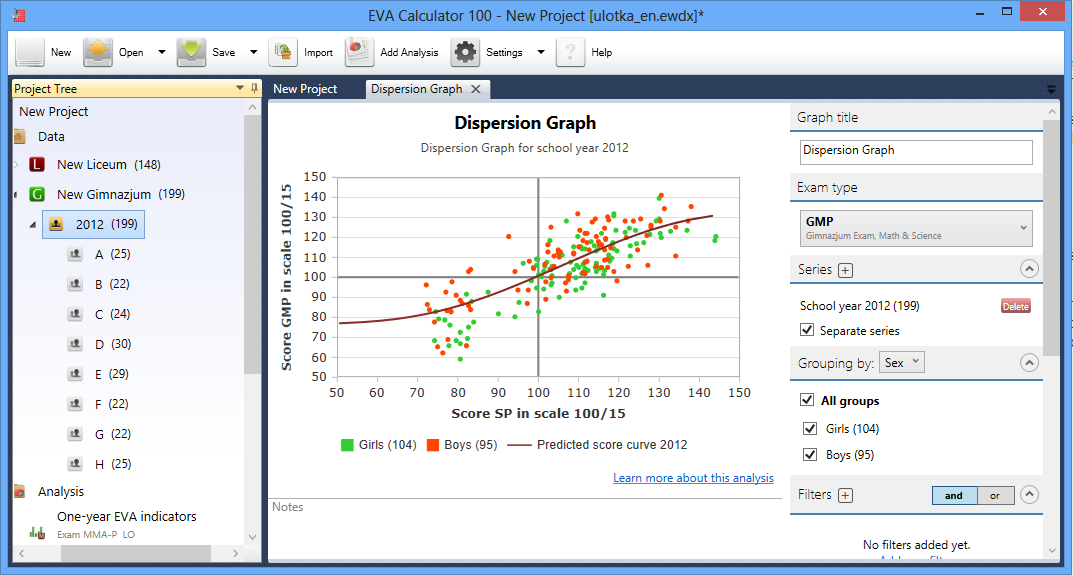
Figure 1. EVA Calculator 100 computer program for within-school evaluation
The second model in the lower secondary school is based on random effect regression models and takes into account a three year period of teaching. Three cohorts are combined and EVA is estimated on pooled three years data. Empirical Bayes and shrinkage estimation technique are used. Results from this model are presented on the website in an innovative graphical manner. A two dimensional space is presented where the first dimension reflects the mean scores of the school and the second dimension reflects EVA results. Schools are placed on this space by ellipses, which reflects uncertainty both of average performance (measured by school mean score) and school effectiveness (measured by EVA). Ellipses are drawn based on the Mahalanobis distance and may be interpreted as a graphical version of a statistical test on two parameters equality. An example of such a presentation is shown on Figure 2. The bigger the ellipses, the greater is uncertainty about measurement. Two schools with overlapping ellipses are indistinguishable with respect to effectiveness and the level of performance.
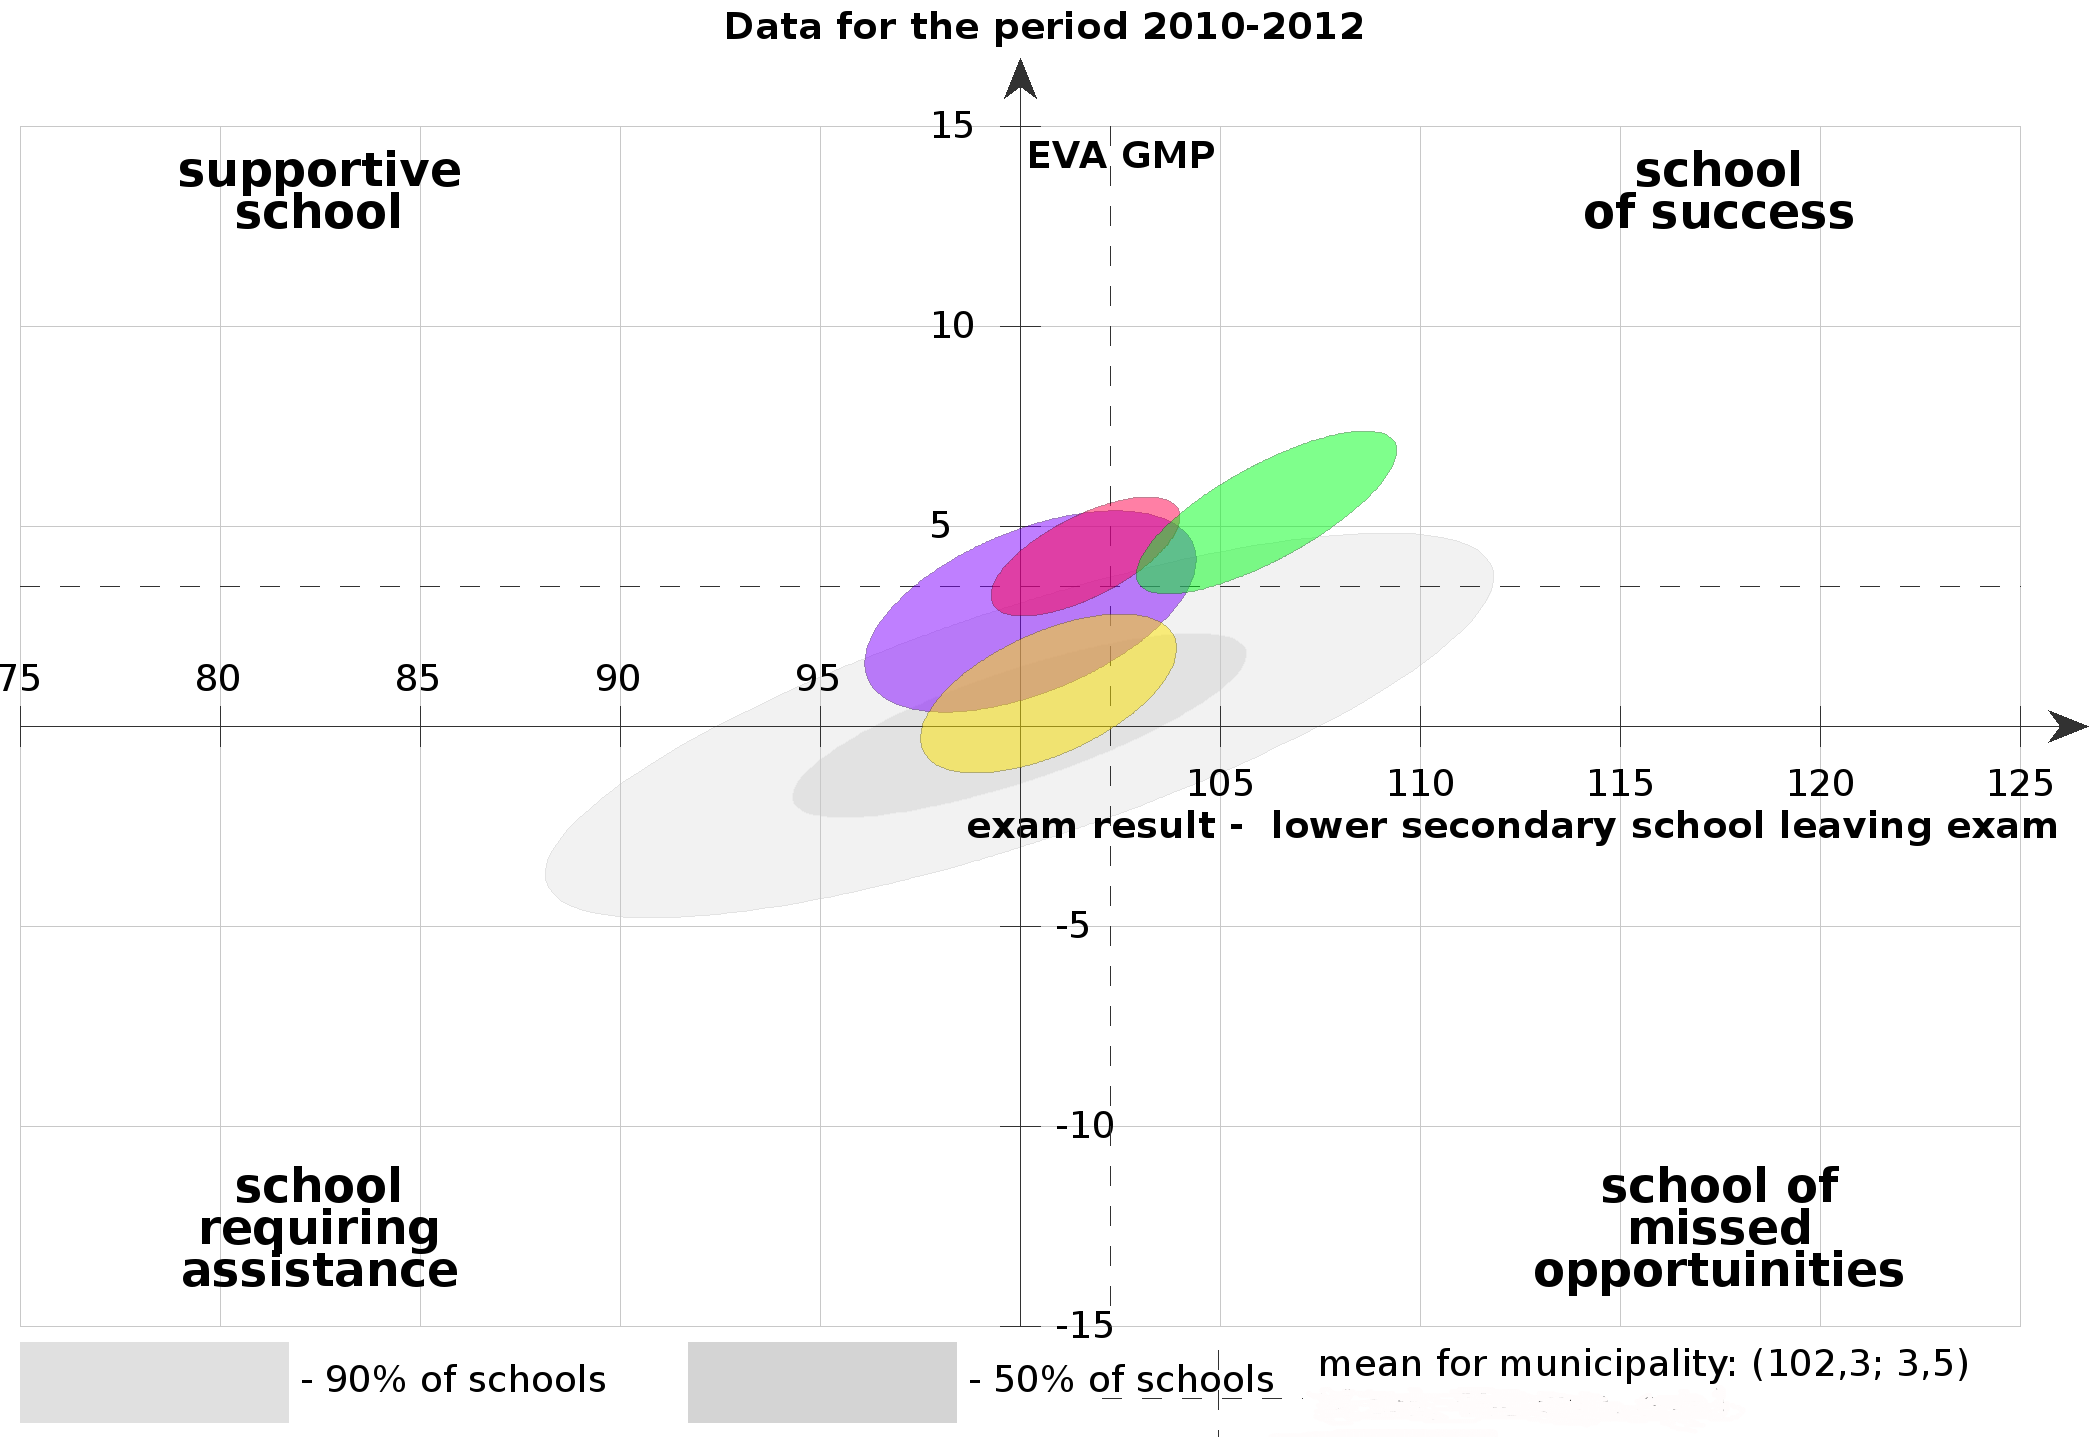
Figure 2. Two dimensional space of overall school performance
This graphical tool allows to derive proper conclusions about the effectiveness of schools and provides an opportunity to compare schools properly taking into account uncertainty of the measurement. Value added models for the lower secondary school are available for two blocks of subjects separately: Humanities and Maths&Science.
An analogous model and form of presentation is used for EVA on higher secondary school level with one differences. Firstly, models are available for four domains: Mathematics, Polish, Humanities and Math & Science. These domains represent combined scores from more than 20 examination subjects presented in the higher secondary school exam (Matura Exam). Scores for each domain are scaled by two parametric IRT models with a selection parameter. This solution was introduced because except for Maths and Polish, other tests are voluntary (but are taken into account in college recruitment).
Teachers' and Headmasters' opinions about EVA
Although EVA measures are not compulsory (schools are not obligated to use them in evaluation), they receive considerable attention which may be shown by growing number of downloads of the computer program and visitors on the site. To monitor implementation of information on the EVA we also have begun a longitudinal study in 150 secondary schools. The first results show that headmasters are confident of EVA as an indicator of the school's effectiveness: 83.7% of the headmasters chose the answer "useful" and "rather useful". Teachers are more skeptical - only 51.9% of the teachers see EVA as a useful tool. This difference in perception of educational value can be explained by the fact that the headmasters see their chance for a positive assessment of schools operating in difficult environments, and teachers fear that EVA will be used to evaluate their performance.
Literature
- Hanushek E., A. (1986) The economics of schooling: production and efficiency in public schools. Journal of Economic Literature, vol. 24, pp. 1141-1177.
- OECD (2008), Measuring Improvements in Learning Outcomes: Best Practices to Assess the Value-Added of Schools, OECD, Paris.
- Raudenbush, S.W. (2004) „What Are Value-Added Models Estimating and What Does This Imply for Statistical Practice?” Journal of Educational and Behavioral Statistics, 29, 121-129.
- Raudenbush, S.W. and Willms, J.D. (1995) „The estimation of school effects.” Journal of Educational and Behavioral Statistics, 20, 307-335.
- Reardon, S. F. and Raudenbush, S. W. (2008) „Assumptions of Value-Added Models for Estimating School Effects.” Education Finance and Policy, 4, 492519.
- Rothstein R. (2004) Class and schools. Using social, economic, and educational reform to close the Black-White achievement gap. Washington, Teachers College, Columbia University.
- Rubin, D. B., Stuart, E. A. and Zanutto, E. L. (2004) „A Potential Outcomes View of Value-Added Assesment in Education” Journal of Educational and Behavioral Statistics, 29, 103-104.
- Schagen I., Hutchinson D. (2003) Adding value in educational research - the marriage of data and analytical power. British Educational Research Journal, vol. 29, no. 5.
- Jakubowski M.(2008) Implementing Value-Added Models of School Assessment. EUI Working Paper RSCAS 2008/06.
- Dolata R. (red.) (2007) Edukacyjna wartość dodana jako metoda oceny efektywności nauczania na podstawie wyników egzaminów zewnętrznych (Educational Value Added - the method to measure school performance based on examination scores). CKE, Warszawa.